App statistics
RuStore Console lets you view statistics for your apps.
Statistics are available to authorized users only.
How to view version download statistics:
- Open RuStore Console.
- Go to the Apps tab.
- Click App statistics in the side menu.
Statistics interface
The statistics tab contains the following elements:
-
Time period selector
tipTo change the period, click the time period values:

The chart step depends on the length of the selected period. For example, if you select a year, the step is a month; if you select a month, the step is a week. :::
-
RuStore page views
Unique users who viewed the page in the RuStore mobile app.
TipNote that only views from the mobile app are counted. Views from a browser are not tracked.
-
App installs
The number of first-time installs of the app.
-
App version updates
Statistics on app version updates.
-
Conversion to install
The ratio of app installs to the total number of views of its page.
Displayed data
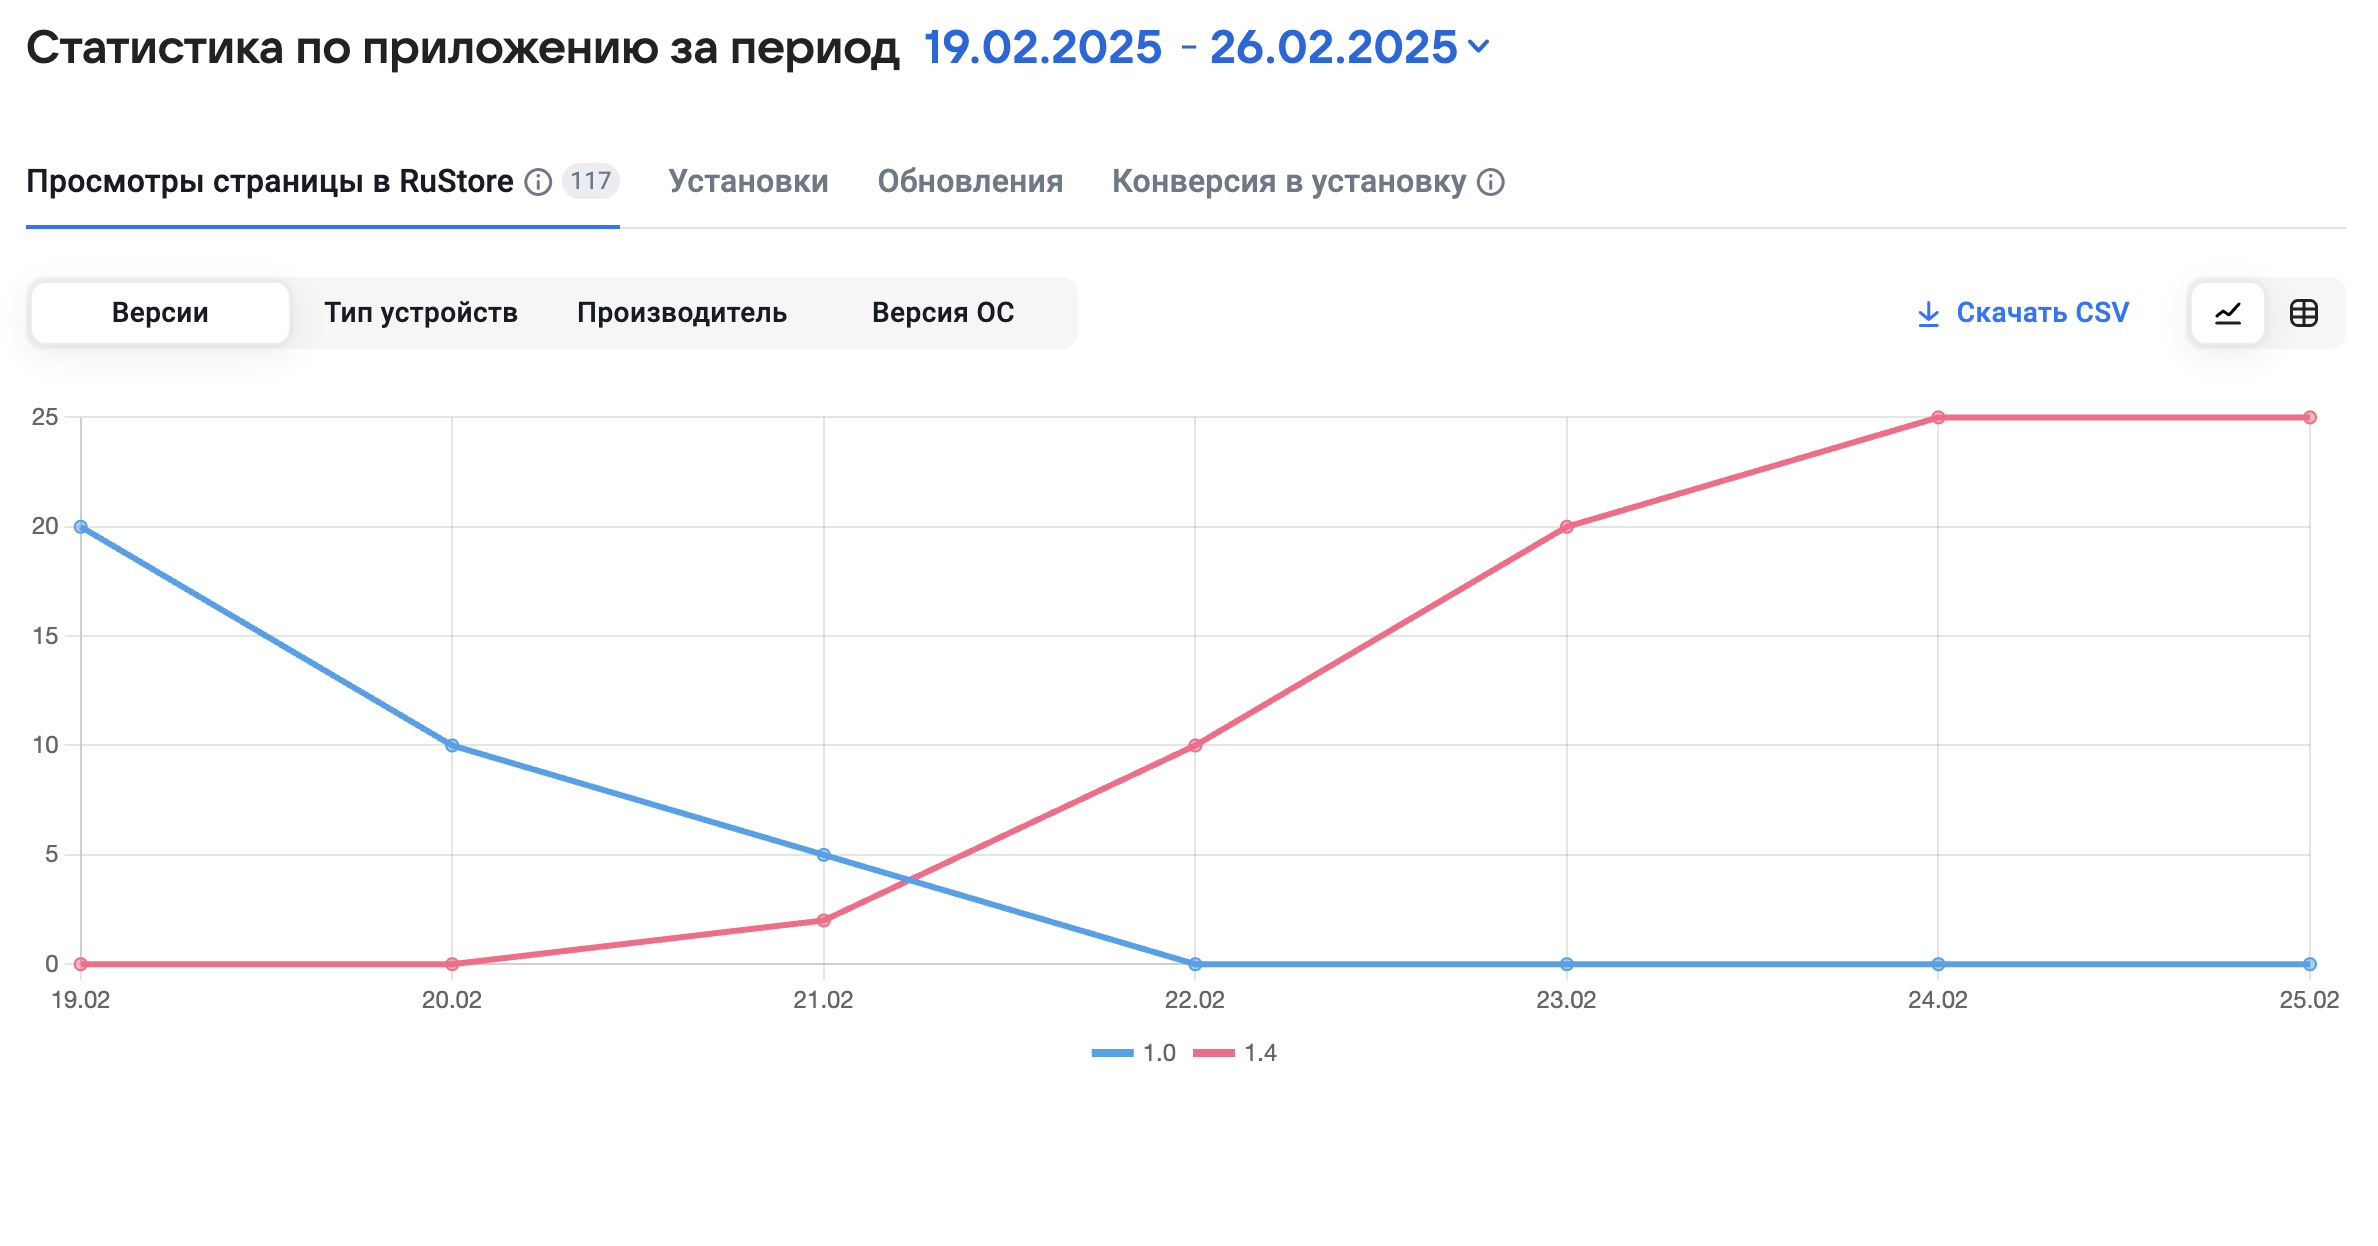
Data can be displayed in two formats: as an interactive chart or as a table. The chart includes:
- Timeline that lets you view statistics for the selected period.
- Values of the selected metrics: updates, installs, views, conversion.
Statistics filters
You can break down each metric with filters to see what makes up the total: which app versions, devices, traffic sources, and countries.
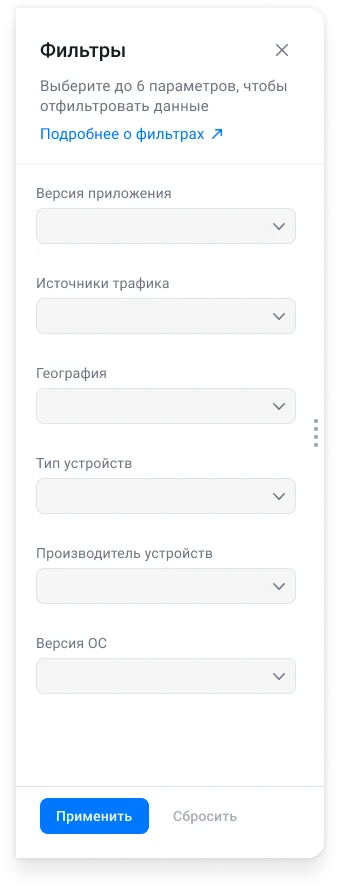
Filters open with the Filters button above the chart. The following parameters are available:
- App version
- Traffic sources – where the user came from before performing the target action.
- Geography – the countries where your users are located.
- Device type – for example, phone or tablet.
- Device manufacturer
- OS version
How to use filters
-
Select the period for which you want to view statistics.
-
Select a metric on the tab above the chart.
The set of traffic sources depends on the selected metric. For details, see Traffic sources.
-
Click Filters and select the values you need in one or more fields.
-
Click Apply.
Each selected value is shown as a separate line on the chart and as a separate row in the table.
-
To return to the total metric values, click Reset.
You can select up to six values at a time, counted across all filter fields combined. The limit keeps the chart and legend readable.
After you select the sixth value, the remaining values become unavailable. When you hover over such a value, the Maximum number of parameters selected – 6 tooltip appears.
The chart shows the 10 most frequent values for the selected period. This applies to all filters.
If several filters are selected at once, the chart shows the 10 most frequent combinations of their values, for example, "Russia • App catalog". To view all values, switch to the table view or download the CSV file.
Traffic sources
A traffic source (acquisition channel) is the RuStore section or external page where the user was before performing the target action: viewing the app page, installing, or updating the app.
What the sources mean
- Inside RuStore – includes organic traffic and advertising, as well as all cases where a user who already has the app installed received a version from RuStore for the first time.
- Search – visits from RuStore search.
- App catalog – the list of apps in the Featured, Apps, and Games sections.
- My section – including the notification feed.
- Featuring – editorial app collections in any RuStore section.
- Reinstall via RuStore – automatic delivery of a version from RuStore for an app that is already installed.
- Auto-update – automatic version update when the user has enabled this permission on their device.
- SDK Update – receiving a version from RuStore through the Update notification inside your app.
- Other – new sources or sources not included in the current list.
- External channels – all visits to RuStore from outside, including deep links and push notifications.
Which sources are available for each metric
For the All installs and Conversion to install metrics:
- Search;
- App catalog;
- My section;
- Featuring;
- Reinstall via RuStore;
- SDK Update;
- Other.
For the Updates metric:
- Search;
- App catalog;
- My section;
- Featuring;
- Auto-update;
- SDK Update;
- Other.
For the Page views metric:
- Search;
- App catalog;
- My section;
- Featuring;
- Other.
The list of sources is the same for all apps. A source appears in the filter even if there is no data for it in the selected period.
External sources
Visits from outside RuStore are identified by UTM tags in the link to the app page. The following tags are available in the filter:
utm_source;utm_medium;utm_campaign;utm_content;utm_term.
External channels work differently from internal sources. For internal sources, you select a specific value, for example, "Search". A UTM tag defines a grouping rather than a value: if you select utm_campaign, you get a breakdown by all your campaigns.
The chart shows the most popular tag values for the selected period. The full list is available in the table view and in the CSV file.
Data for an external channel appears in the statistics only if the link the user came through contains the corresponding UTM tags.
User geography
The Geography filter shows the distribution of metrics by the countries where your users are located.
The user's country is determined by IP address.
If the user has denied the app access to geolocation or uses a VPN, their country is still determined by IP address and may differ from their actual location.
When working with the list of countries:
- countries are sorted from the most to the least popular;
- to find a country quickly, start typing its name in the search field – search works on part of a word.
Display format and export to file
Use the controls in the upper-right corner of the table to change the display format and export statistics to a file:
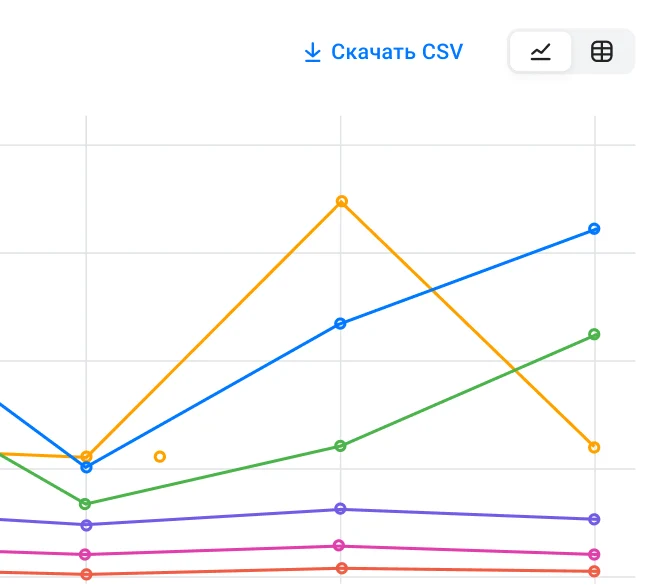
The interface supports the following formats:
- Chart
- Table
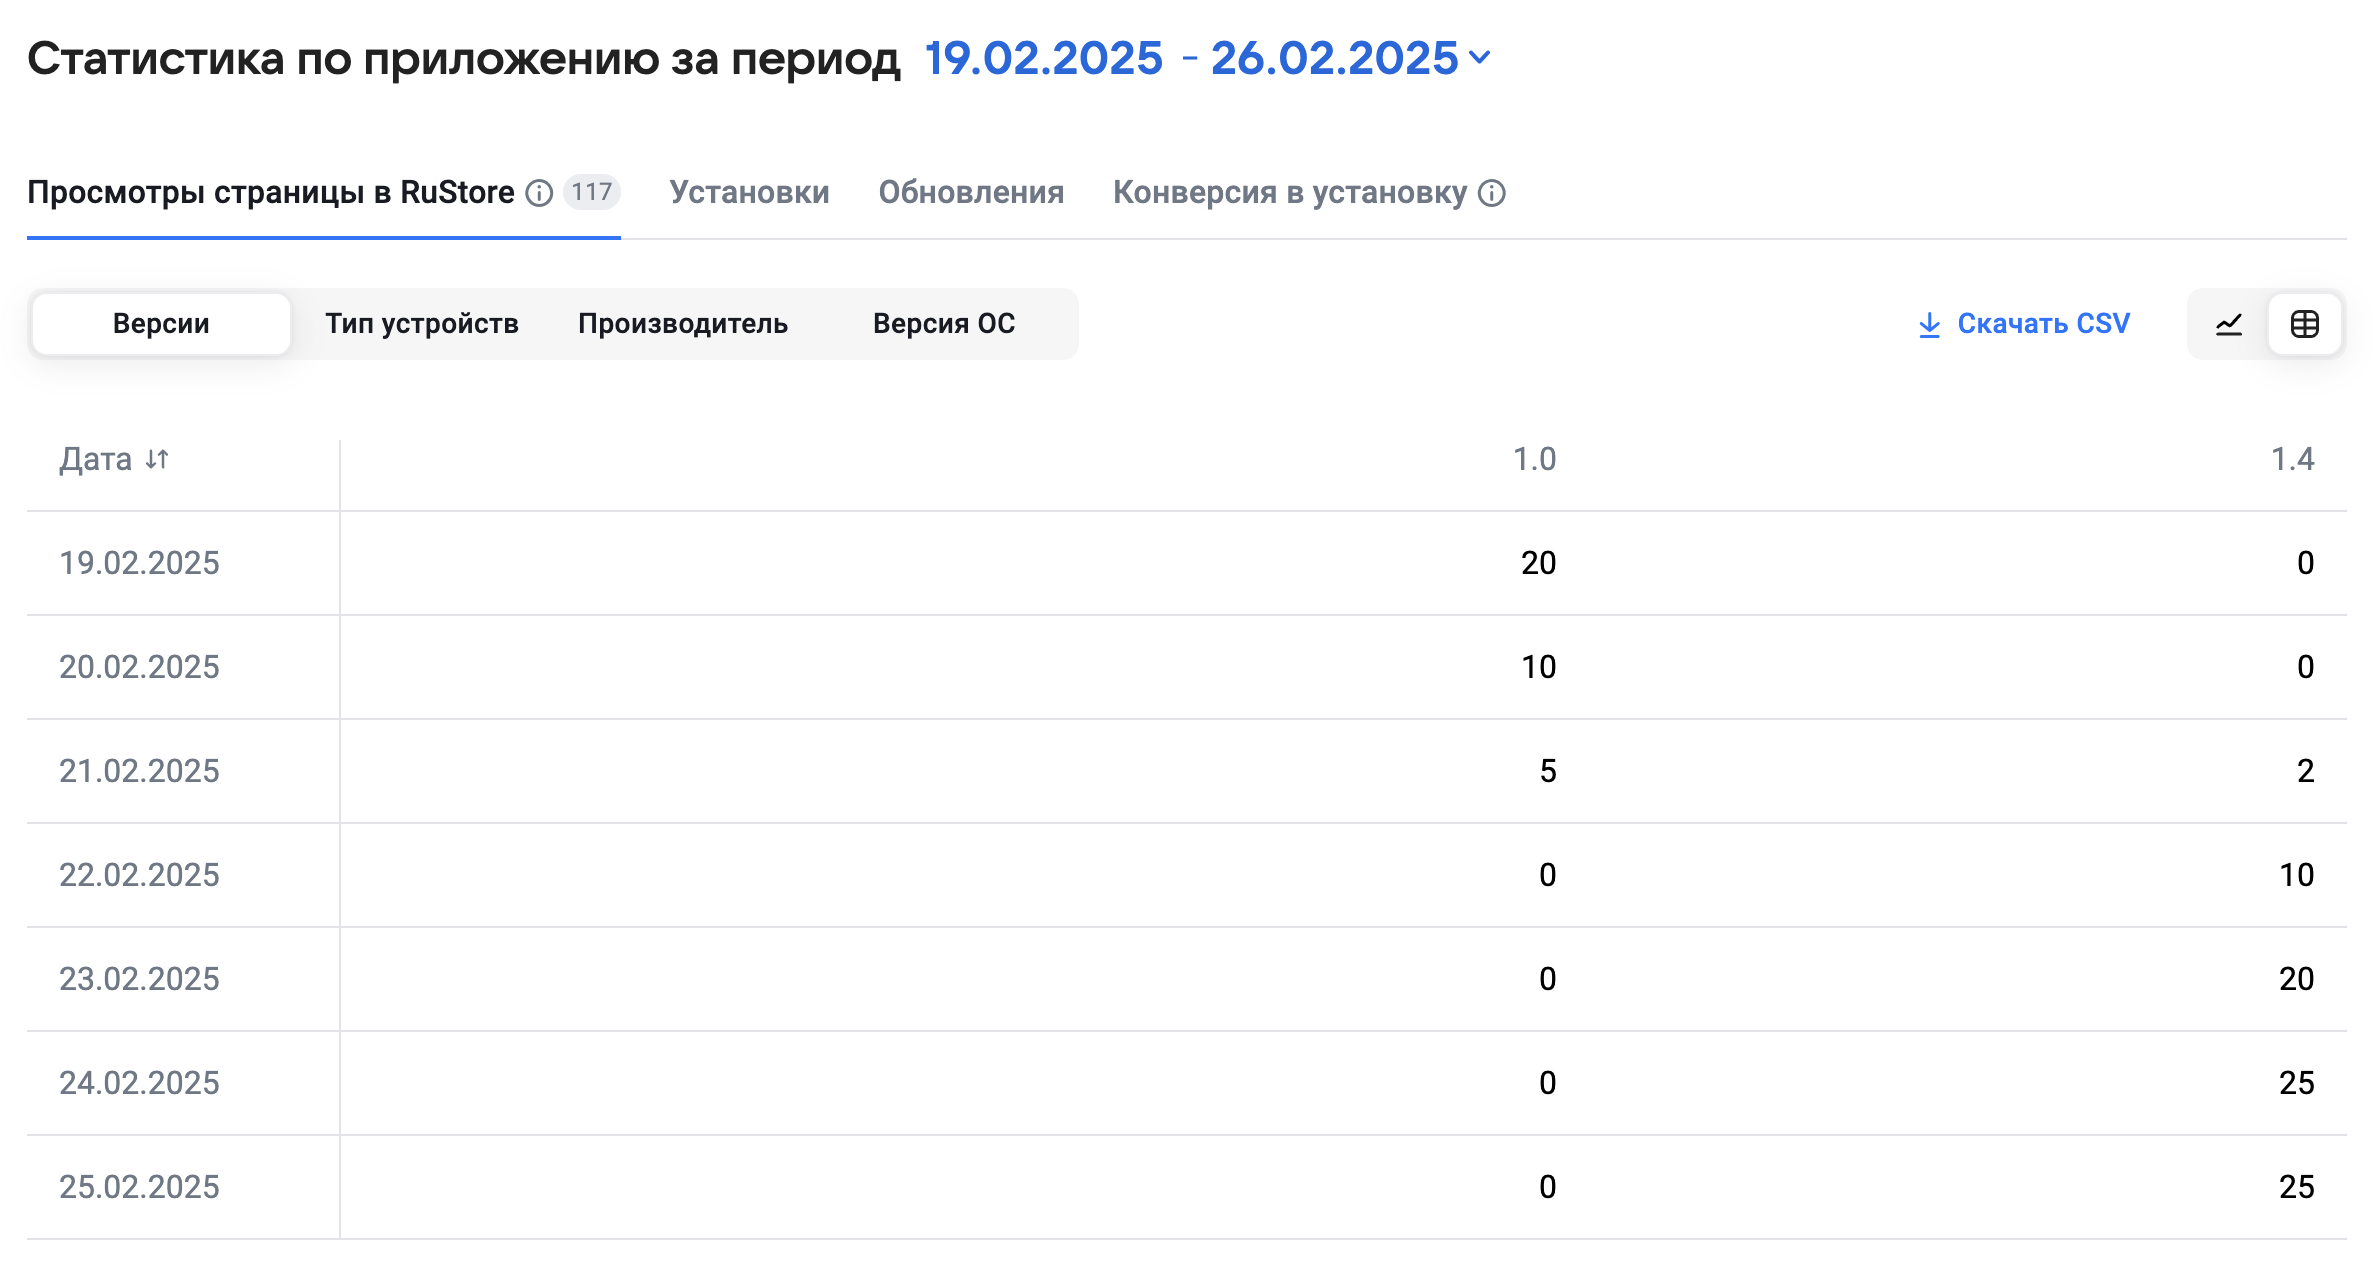
The file contains data for the selected period, with the selected filters and the current display format applied.